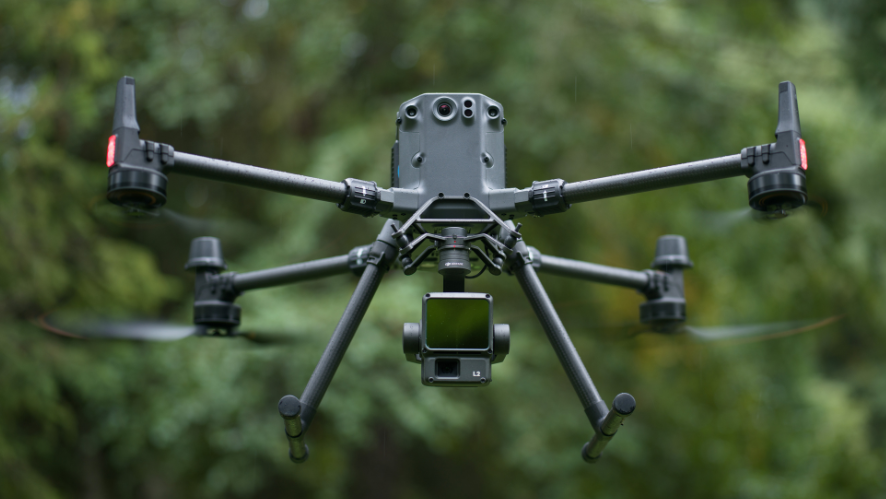
Knowing vegetation indices is essential for optimal precision agriculture, as well as for carrying out other related activities. Drones have become a multi-purpose tool that is being of great help in many of the fields we know today.
With regard to agriculture, drones collect a large amount of information thanks to which a new term known as precision agriculture has been coined, which is based on applying the latest technologies and information systems to all operations carried out within the sector in order to improve its performance and profitability.
Drones are capable of capturing the necessary images to subsequently carry out a thorough analysis, allowing farmers to check their entire plantation in a much more efficient and dynamic way. They will be able to obtain the necessary information regarding the evolution of their crops and proceed to carry out the necessary tasks.
Thanks to the multispectral cameras that this type of technology incorporates, it is possible for farmers to capture the tiniest changes in visible and infrared radiation, thus allowing them to monitor plants under stress, control the growth of all crops, the frequency of irrigation, the planning of sowing and harvesting, among many others.
What are some of the different types of vegetation indices that there are?
Within precision agriculture, there are several vegetation indices. Here are some of the main ones, as well as a brief explanation of each and every one of them.
EVI. Enhanced Vegetation Index
The Enhanced Vegetation Index (EVI) refers to the atmospheric effects that exist. This index is calculated from the difference in radiation between the blue and red bands. Its main advantage is that it allows the person calculating it to monitor the state of vegetation in high amounts of biomass. Often, this index helps to analyse those areas of land with high amounts of chlorophyll and small topographic effects.
SAVI. Soil Adjusted Vegetation Index
The Soil Adjusted Vegetation Index or SAVI was designed to minimise the influences of ground shine. Its developer was able to correct for the effects of ground noise, such as colour, humidity, site variability, etc., which usually affect the results in one way or another.
Typically, this vegetation index is used to analyse young crops with very arid regions, sparse vegetation (less than 15% of the total area) and exposed soil surfaces.
ARVI – Atmosphere Resilient Vegetation Index
The Atmosphere Resilient Vegetation Index, also known as ARVI, is the first relatively atmosphere-resilient index. Measured at blue band wavelengths, this formula corrects the NDVI for the effects of atmospheric scattering and red band reflectance.
In general, this vegetation index is often used over regions with very high atmospheric aerosol content, such as rain, dust, smoke, air pollution or fog, among others.
GCI. Green Chlorophyll Index
The Green Chlorophyll Index or GCI is normally used to estimate the existing chlorophyll content in the leaves of different types of plants. This chlorophyll content is able to reflect the physiological state of the vegetation, as well as decreasing in stressed plants. Therefore, this index is very useful for assessing the hardiness of plants. It can also be used to monitor the impact of seasonality or environmental stress.
SIPI. Structure Insensitive Pigmentation Index
The Structure Insensitive Pigmentation Index, or SIPI, is used to analyse vegetation with variable canopy structure, i.e. it is used to calculate the ratio of carotenoids to chlorophyll, showing the various higher value signals of stressed vegetation.
It is often used to check plant health at sites with high variability of canopy or leaf area index and can make a quick detection of plant diseases.
NBR. Normalised Burn-in Rate
The Normalised Burn Index, or NBR, is used to calculate and quantitatively identify areas that are burnt. It focuses on measuring NIR (healthy vegetation) and SWI (burnt vegetation) wavelengths. It is a parameter which allows the detection of active fires, so in recent years it has become very efficient.
dNBR. Difference normalised burning index
Thanks to the dNBR, it is possible to compare the images before and after the fire, making it possible to make a very accurate assessment of the severity of the fire.
Advantages of measuring vegetation indices with drones
The analysis of vegetation indices with drones has many advantages. The most important of these are listed below.
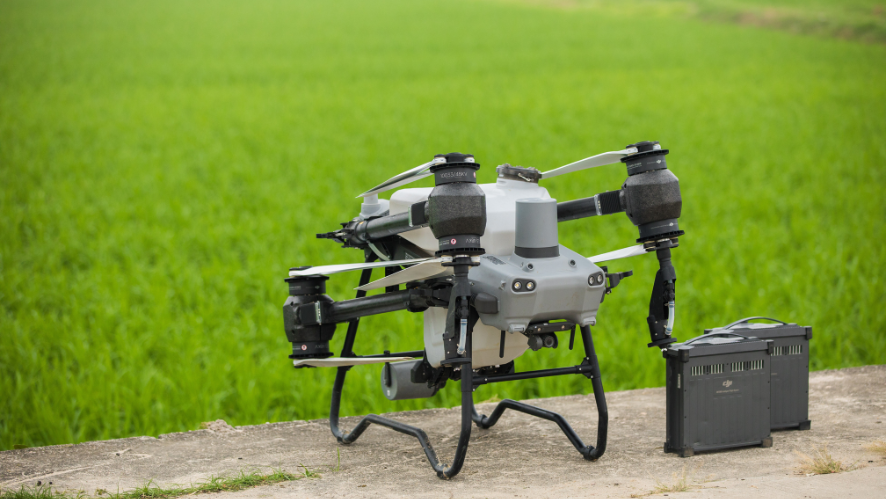
- Collect and process a greater amount of data. Thanks to the different types of cameras, drones are able to provide information from the ground, and the farmer can install the cameras he needs depending on what he sees. For example, our DJI Agras series includes intelligent drones that take care of all the activities that are necessary for the correct maintenance of crops, such as spraying or applying phytosanitary products.
- Detecting pests in the crops. With drones it is possible to detect crop pests and diseases and choose the most appropriate type of treatment for each situation, planning the necessary pruning or pest prevention measures.
- Reducing costs. The use of drones has the advantage of being able to reduce costs, optimising the use of water, fertilisers and phytosanitary products.
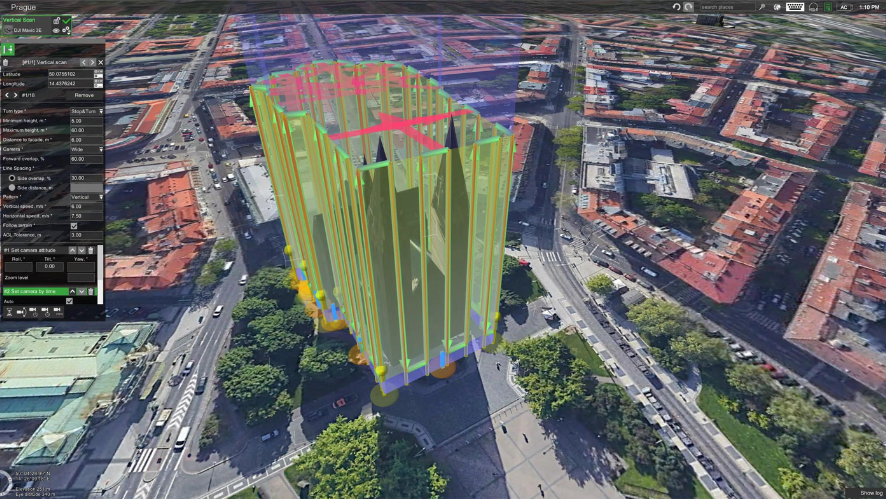
- Better planning, both in terms of crops and treatments. Drones are capable of improving the planning of harvests and the necessary treatments, thanks to the foresight and anticipation provided by a quick and constant analysis. At HPDRONES we provide all our customers with DJI Terra, drones that include mapping software with a series of features that offer the possibility of analysing the terrain where the crops are located.
After the above mentioned, it is possible to conclude that more and more farmers can enjoy all these benefits, which are within the reach of each and every one of them. Thanks to drones, it is possible to achieve maximum yields within the agricultural sector.


